
Build a Multi-Sensor Smartwatch with Medical Sensors - Hackable
24 August 2026
How to Build a Multi-Sensor Smartwatch with Medical Sensors
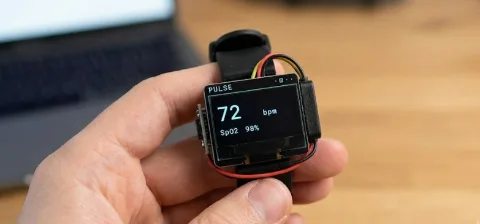
A complete build guide for a wearable sensor platform on the Seeed XIAO nRF52840: heart rate, blood oxygen, near-infrared spectroscopy, environmental sensing, an OLED display, and a live dashboard on your PC.
Four sensors, one I2C bus, no library dependencies. Everything here is open source.
What you will build
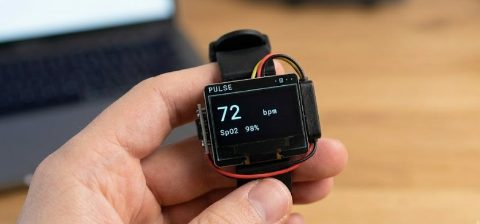
A wrist-sized board that measures:
- Heart rate and blood oxygen (SpO2) from a fingertip, using red and infrared light
- Six near-infrared spectral bands from 610 to 860 nm, with a switchable illumination LED
- Temperature, barometric pressure and humidity
- All of it displayed on a 0.96 inch OLED with four pages you cycle with a button
Plus a web dashboard on your PC that reads live telemetry over USB.
This is an engineering project, not a medical device. I will come back to that point, because it matters and it is the part most build guides skip.
Parts list
| Part | Model | Cost (approx) | What it does |
|---|---|---|---|
| Microcontroller | Seeed XIAO nRF52840 | $10 | nRF52840, USB-C, BLE, thumbnail sized |
| Pulse oximeter | MAX30101 breakout | $8 | Red + IR photoplethysmography |
| Spectral sensor | AS7263 breakout | $25 | 6-channel near-infrared |
| Environmental | BME280 breakout | $5 | Temperature, pressure, humidity |
| Display | SSD1306 0.96" 128x64 I2C OLED | $4 | Monochrome, 4 pins |
| Input | Any momentary push button | $0.10 | Page switching |
| Wiring | Jumper wires, breadboard or perfboard |
Why the XIAO nRF52840. It is roughly the size of a thumbnail, has native USB, runs on a LiPo battery with onboard charging, and has Bluetooth Low Energy built in for when you want to send data to a phone. For anything wrist-worn, the size alone makes the decision.
Substitutes work. The MAX30102 and MAX30105 are drop-in replacements for the MAX30101. The AS7262 (visible light) uses identical registers to the AS7263. The BMP280 works if you do not need humidity. I cover swapping parts near the end.
Wiring
Every device sits on the same I2C bus. Two wires carry all the data.
| Signal | XIAO pin | Port | Connect to |
|---|---|---|---|
| SDA | D4 | P0.04 | SDA on every sensor and the display |
| SCL | D5 | P0.05 | SCL (or SCK) on every sensor and the display |
| 3V3 | 3V3 | VDD or VCC on every board | |
| GND | GND | GND on every board | |
| Button | D0 | P0.02 | One leg of the button, other leg to GND |
Three things that will save you an evening:
Check your display's pin order. The module I used is marked RG0.96 IIC V2.0 and its pins run GND, VDD, SCK, SDA. Ground comes first. Most other modules are VCC, GND, .... If you wire it by habit you will reverse power to the display.
Tie the BME280's SDO pin. SDO selects the I2C address: low gives 0x76, high gives 0x77. If you leave it floating, the address drifts between the two at random. The symptom is a sensor that works for a few seconds and then vanishes, which looks exactly like a loose wire and will waste your time. Solder it to GND.
You need pull-up resistors. I2C requires them on both SDA and SCL. Most breakout boards include them, so with several modules on the bus you are fine. If you are wiring bare chips, add 4.7k to 3V3 on each line.
Free pins if you want to add more sensors later: D1, D2, D3, D6, D7, D8, D9, D10.
The one architectural decision that matters
Before any code, there is a decision that will determine whether your build works or mysteriously freezes: do not use the Arduino Wire library on this board.
I need to explain why, because it is counterintuitive and it is the single most important thing in this guide.
The nRF52 Arduino Wire driver waits on hardware events like this:
while(!_p_twim->EVENTS_RXSTARTED && !_p_twim->EVENTS_ERROR);
while(!_p_twim->EVENTS_LASTRX    && !_p_twim->EVENTS_ERROR);
while(!_p_twim->EVENTS_STOPPED);
Those loops have no timeout. If the expected event never arrives, your CPU stops there forever. Not an error, not a retry, just a dead board that still enumerates over USB because the USB stack runs from interrupts.
The AS7263 triggers exactly this. It does not expose its registers directly; you talk to it through a three-register mailbox, and behind that mailbox sits a small microcontroller. While that micro works, the sensor stretches the clock, holding SCL low to say "wait". Clock stretching is a normal, legal part of I2C. The nRF52 hardware peripheral mishandles this particular case, leaves the data line held low, and the next call never returns.
The fix is to drive the bus in software. Roughly 400 lines gets you an I2C master where:
- every wait has a timeout, so a misbehaving device returns an error instead of hanging
- releasing the clock line waits for it to actually rise, which is what clock stretching genuinely requires
- transactions retry, absorbing the occasional glitch when a USB interrupt lands mid-transfer
- a stuck bus can be recovered by pulsing the clock nine times
Here is the part that does the real work:
bool sclRelease() {
    release(scl);
    const uint32_t start = micros();
    while (digitalRead(scl) == LOW) {
        if ((uint32_t)(micros() - start) > STRETCH_TIMEOUT_US)
            return false;          // bus is broken, return instead of hanging
    }
    delayMicroseconds(HALF_PERIOD_US);
    return true;
}
What does it cost? Almost nothing. The pulse sensor runs at 100 Hz with 4x averaging, which is about 25 samples per second of 6 bytes each. At 100 kHz that is a couple of percent of one core. The throughput you give up is throughput you were never using.
I did try a hybrid: hardware I2C for the well-behaved sensors, software only for the AS7263. It failed. After the AS7263 had used the pins, the pulse sensor's ID read over hardware I2C started failing, while the same read in software worked perfectly. The peripheral does not reliably survive sharing those pins. One software bus for everything is simpler and it works.
Bring the sensors up one at a time
Here is the habit that will save you the most time on a multi-sensor build: write a diagnostic firmware before you write the application.
The project has two builds. The diagnostic one initialises nothing on boot except the serial console, then tests one device at a time when you press a key:
 h  help
 p  check SDA/SCL idle levels (no I2C traffic at all)
 r  bus recovery, pulse 9 clocks to free a stuck slave
 d  scan and identify every device
 1  test the MAX30101 alone
 3  test the AS7263 alone
 4  test the BME280 alone
 5  test the SSD1306 alone
Flash it, press d, and you get this:
---- bit-banged scan + identify ----
  3 device(s):

  0x49:
      DEVICE_TYPE (v0x00) = 0x40
      HW_VERSION  (v0x01) = 0x3F  -> AS7263 (NIR)

  0x57:
      part-ID (0xFF) = 0x15   rev-ID (0xFE) = 0x06  -> MAX30101/30102/30105

  0x76:
      chip-ID (0xD0) = 0x60  -> BME280

That output is worth more than it looks. A plain address scan tells you something is at 0x49. Reading its ID register tells you what, and those are different questions.
On my build they gave different answers. The code I started from assumed an AS7262 (visible light, 450 to 650 nm). The chip fitted was an AS7263 (near-infrared, 610 to 860 nm). Same address, same registers, same everything except the optical filters. The driver happily returned six real numbers labelled "Violet, Blue, Green, Yellow, Orange, Red" when they were actually infrared wavelengths. Nothing errored. It would have produced confidently wrong data forever.
Verify what is on your bus, not what your code assumes is on your bus.
Sensor 1: heart rate and blood oxygen
How it works
The MAX30101 shines red light (around 660 nm) and infrared (around 880 nm) into your fingertip and measures how much comes back. With every heartbeat, blood volume in the tissue rises and falls, so the reflected light pulses. That waveform gives you heart rate.
Blood oxygen is cleverer. Oxygenated and deoxygenated haemoglobin absorb red and infrared light in different proportions. Take the ratio of the pulsating component to the steady component in each channel, then take the ratio of those two ratios, and you get a number that tracks oxygen saturation.
Configuration
sensor.setup(
    0x1F,   // LED power
    4,      // sample averaging
    2,      // RED + IR
    100,    // sample rate, Hz
    411,    // pulse width, microseconds (18-bit resolution)
    16384   // ADC range
);
100 Hz with 4x averaging gives about 25 samples per second, which is what the algorithm expects.
Getting a number you can trust
This is where most tutorials stop, and it is where the interesting work starts. Raw algorithm output is noisy. On a perfectly clean signal I measured raw heart rate bouncing between 42 and 150 bpm.
So the reading goes through eight stages, each able to reject the sample:
- Drain the FIFO every loop pass, giving 18-bit red and IR counts.
- Detect the finger with hysteresis. On above 15000 counts, off below 10000 for five consecutive samples. Two thresholds stop it chattering at the boundary. Losing contact wipes the filter history so a new session never inherits the last finger's numbers.
- Fill a 4 second sliding window. 100 samples at 25 Hz, sliding 25 at a time, so you get a fresh result about once a second without waiting 4 seconds each time.
- Gate on signal quality. Four checks, all must pass:
- IR DC level between 5000 and 60000
- perfusion index at least 0.20 percent
- baseline drift between window halves at most 20 percent
- red channel perfusion at least 0.05 percent
- Run the algorithm for peak detection and the ratio-of-ratios.
- Range check. Heart rate 45 to 160 bpm, SpO2 70 to 100 percent.
- Require consensus. Keep the last five accepted candidates, find the largest cluster that agrees within 15 bpm, and publish that cluster's median only if at least three values agree.
- Publish, or show
--if nothing qualifies.
Stage 7 is what makes the display stable. One outlier cannot move a median. And when the filters cannot agree, the screen says measuring rather than showing a number it does not believe.
The honest caveat
SpO2 comes from a lookup table:
n_spo2_calc = uch_spo2_table[n_ratio_average];
That is a generic curve. It is not calibrated to your specific LEDs, your optical path, or your skin. It is well documented to read high and to cluster around 97 to 100 percent almost regardless of true saturation.
Properly calibrating a pulse oximeter means taking reference measurements across a range of oxygen saturations, which for a healthy person means inducing controlled hypoxia under clinical supervision. You cannot do it on a workbench, and you should not fudge an offset to make the number match a commercial oximeter, because that produces a reading that looks right without being right.
Build this to learn how pulse oximetry works. Do not use it to make a health decision.
Sensor 2: near-infrared spectroscopy
The AS7263 is six photodiodes sitting behind six optical interference filters, each tuned to a narrow band:
| Channel | Wavelength | Visible to the eye? |
|---|---|---|
| R610 | 610 nm | Yes, orange-red |
| S680 | 680 nm | Yes, deep red |
| T730 | 730 nm | Just barely |
| U760 | 760 nm | No |
| V810 | 810 nm | No |
| W860 | 860 nm | No |
Different materials reflect and absorb these bands in different proportions, so the six numbers act as a coarse fingerprint of whatever sits in front of the sensor. This is the same principle behind near-infrared spectroscopy used for food analysis and material sorting, at hobby scale and hobby accuracy.
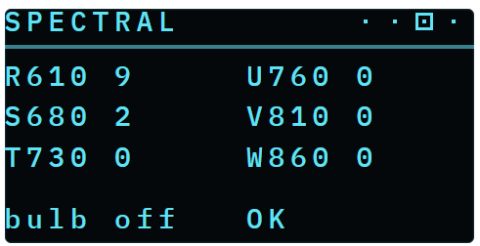
It has its own white LED so readings do not depend on room lighting. Switching it on is the fastest way to prove the sensor works: with the bulb off indoors, R610 reads single digits. Switch it on and it jumps into the thousands.
bulb off:  R610=31    S680=12    T730=8
bulb on:   R610=2240  S680=1118  T730=215
Configuration is gain 16x, continuous mode across all six channels, integration time around 280 ms per frame, read every 250 ms. Each reading is validated and then smoothed with an exponential moving average:
filtered += 0.25 * (new - filtered)
The first valid reading seeds the filter directly, so there is no slow ramp up from zero when you power on.
Sensor 3: environment
The BME280 packs three sensing elements onto one die: a resistive temperature sensor, a piezo-resistive pressure membrane, and a capacitive humidity layer.
The important thing to understand is that its raw output is meaningless on its own. Every individual chip is factory trimmed, and its correction coefficients live in on-chip memory. You read those 33 bytes once at startup, then apply the manufacturer's compensation maths to every sample. Temperature must be computed first, because the pressure and humidity formulas both depend on an intermediate value from it.
One thing worth knowing: pressure is reported as absolute station pressure, not corrected to sea level. It will read lower than your local weather forecast if you are at any altitude. That is correct behaviour, not a fault.
The display
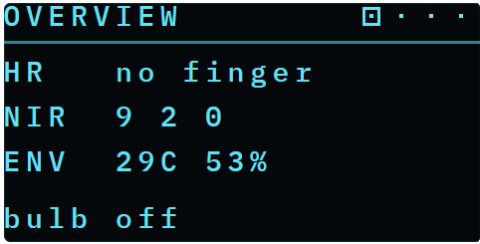
I wrote the SSD1306 driver from scratch rather than using Adafruit_GFX, for a specific reason: Adafruit_SSD1306 talks through Wire, and putting Wire back on this bus brings back the hang described earlier. A self-contained driver keeps everything on the safe software bus.
It is about 300 lines: a framebuffer, a 5x7 font, and drawing primitives.
panel.clear();
panel.drawText(0, 14, "HR   83 bpm", 1);   // x, y, text, scale
panel.drawHLine(0, 10, 128);
panel.display();                            // push the framebuffer
Four pages, cycled with a short button press:
| Page | Shows |
|---|---|
| Overview | Heart rate, SpO2, three NIR channels, temperature, humidity |
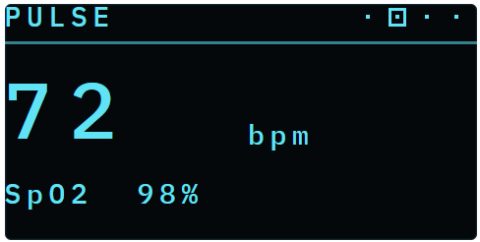
| Pulse | Large BPM readout with SpO2 underneath |
| Spectral | All six NIR channels in two columns |
| Environment | Temperature, humidity, pressure |
A full 128x64 frame is 1024 bytes, which takes about 90 ms on the software bus, so refreshes are capped at 1 Hz. That is comfortably fast enough for readings that update every 250 to 500 ms, and it leaves the pulse sensor's FIFO plenty of headroom.
Two mistakes I made here, both worth avoiding:
Do not disable the display permanently on one failed transfer. My first version did, which meant a single glitched frame killed the display for the rest of the session. Mark it missing and retry instead.
Give the display time to boot. The SSD1306's charge pump is still settling when the microcontroller has already finished starting up. Probe it immediately and a perfectly good panel looks absent. Wait 100 ms, then retry every few seconds.
The button
One momentary switch on D0 to ground. It uses the microcontroller's internal pull-up, so you need no external resistor. A bare jumper wire touched to a ground pad works for testing.
- Short press: next display page
- Long press (over 0.7 seconds): toggle the spectral sensor's illumination LED
Poll it from the main loop rather than using an interrupt. An interrupt firing partway through a software I2C transfer would corrupt the bit timing.
The PC dashboard
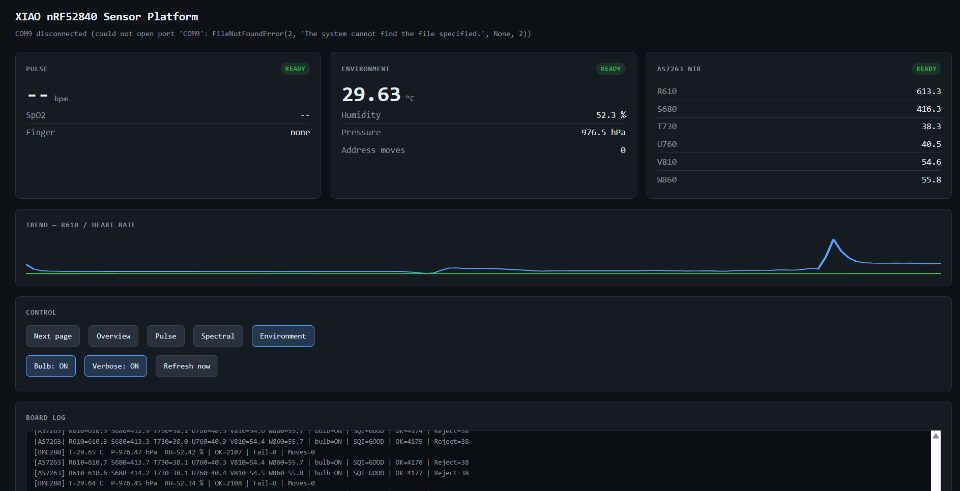
The firmware prints one compact JSON line per second over USB:
#D {"up":727,"finger":1,"hr":83,"spo2":98,"nir":[30.5,8.1,2.2,1.6,1.7,1.1],
    "temp":29.35,"press":977.05,"hum":53.2,"page":0}
Strip the #D prefix and it is plain JSON. That is the whole integration contract. Log it, graph it, forward it over Bluetooth, feed it to anything.
A small Python script parses that stream and serves a live dashboard at localhost:8080 with cards per sensor, a trend chart, and buttons that drive the display and the illumination LED remotely. Its only dependency is pyserial, which already ships inside PlatformIO's Python environment, so on a machine set up for this project there is nothing extra to install.
Swapping in different parts
Every driver takes a bus interface rather than talking to hardware directly, so substitutions are cheap.
Pulse sensor. The MAX30102 and MAX30105 work with no code change at all. Same part ID, same registers. The MAX30102 has no green LED, the MAX30105 does, which is a one-line configuration difference.
Spectral sensor. The driver detects the whole AS726x family automatically from its hardware version register: 0x3D is an AS7261, 0x3E an AS7262, 0x3F an AS7263. Fitting an AS7262 instead needs no driver change, because the register layout is identical. Only the channel labels differ, since the AS7262 covers visible light rather than infrared.
Environmental sensor. A BMP280 is detected automatically and simply reports no humidity. For something completely different like an SHT31, write a small class exposing begin() and read() and point the wrapper at it.
Display. A 128x32 OLED needs two constants changed. An SH1106 needs a 2 pixel column offset because its RAM is slightly wider than its screen. For a colour SPI TFT you are off the I2C bus entirely, so write a class exposing the same handful of drawing methods and the page layouts carry over unchanged.
What I would tell you before you start
Bring sensors up one at a time. A combined firmware that initialises everything in setup() gives you one bit of information when it fails: it failed. Test devices individually, on command, and you find the culprit in a minute.
Your diagnostics must survive the thing they are diagnosing. My first attempt initialised I2C during startup. When the bus hung, the diagnostic hung with it and printed nothing at all. Move every initialisation behind an explicit command and a dead board becomes a debuggable one.
Read ID registers, do not trust the label. Two of my four devices were not what the code assumed. Neither reported an error.
Unbounded waits are landmines. while(!EVENT); works fine right up until the event does not arrive. Then it is an unrecoverable hang with no diagnostic output. Every wait deserves a timeout and an error path, even when you are sure it cannot happen.
Be suspicious of explanations that merely fit. I once explained a phantom device address as flakiness in the I2C peripheral. It was consistent with everything I had seen, and it was wrong. The real cause was an unconnected pin on a different chip entirely. A story that accounts for the evidence is not the same as the truth.
Get the code
Everything is on GitHub, MIT licensed: firmware, drivers, the diagnostic build, the dashboard, wiring notes, and swap-in instructions for other sensors and displays.
github.com/InsertCart/smartwatch-with-sensors-and-OLED-screen-data-using-nRF
git clone https://github.com/InsertCart/smartwatch-with-sensors-and-OLED-screen-data.git
cd smartwatch-with-sensors-and-OLED-screen-data
pio run -e full -t upload
You need PlatformIO. There are no libraries to install.
If you build one, or adapt it for different sensors, I would like to hear about it.
Not a medical device. Heart rate and SpO2 here are an engineering measurement pipeline built for learning. Do not use them for diagnosis or any clinical decision.